Everything in this guide can be done entirely over the API. The in-app screens exist so you can *see* the fleet without writing a dashboard. They are **read-only**: there is no create, re-sync or delete button, and no token is ever rendered on them.
They are visible to **organisation admins on the white-label plan**, from the **API accounts** item in the left rail (with your fleet count as its pip). A partner who downgrades keeps read-only access for as long as the organisation still holds API accounts.
## Fleet: `/white_label/api_accounts`
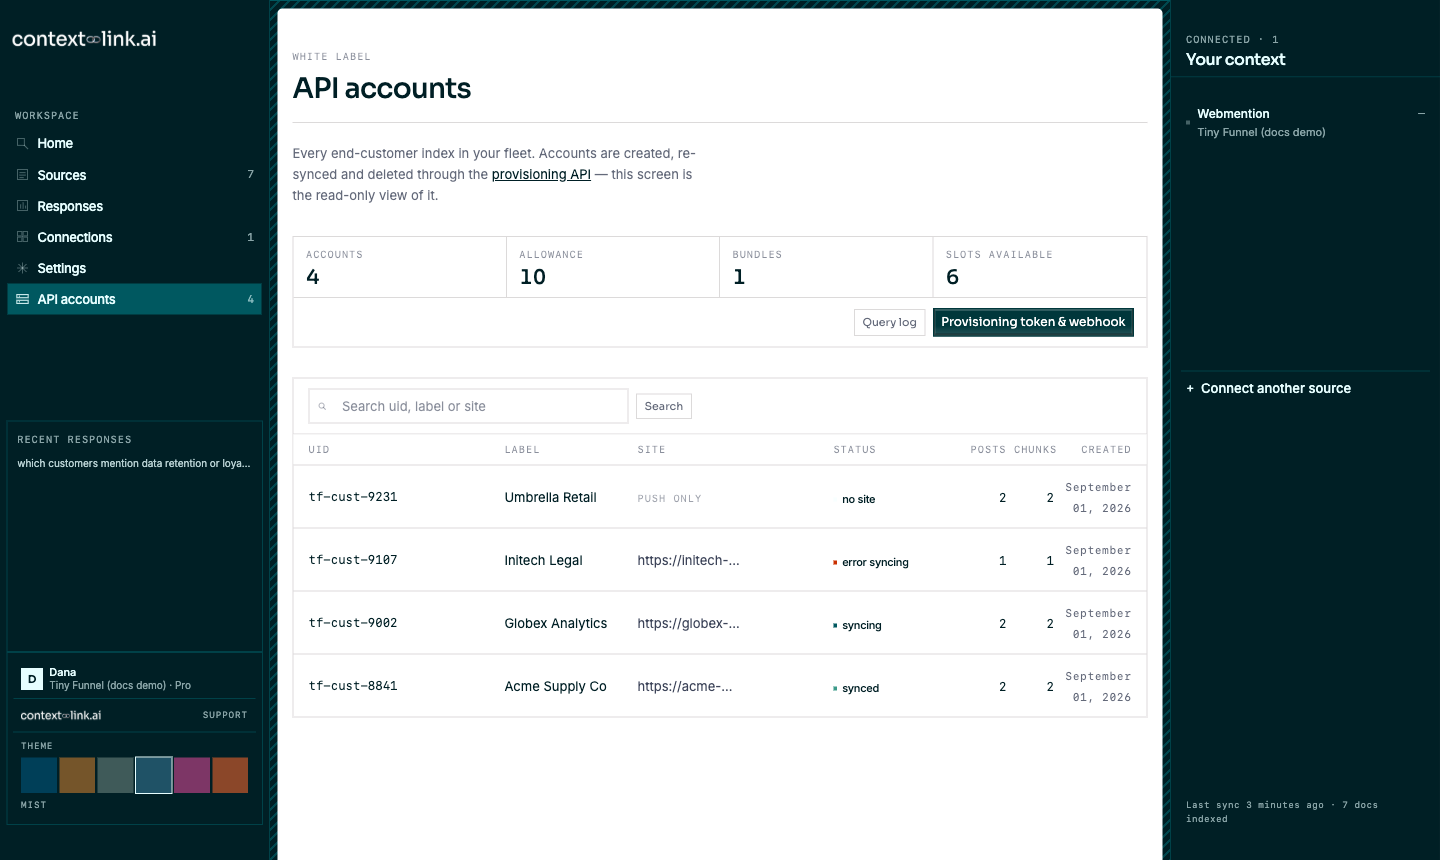
The **usage strip** is the same data the provisioning API returns as `usage`: accounts in the fleet, your allowance, how many bundles you are paying for, and slots left before the next bundle is added automatically.
The **fleet table** is one row per API account, newest first, 25 per page:
| Column | What it shows |
|---|---|
| uid | Your own customer id, the address for every API call |
| label | The display name you passed as `label` |
| site | `https://` of the crawled website, or **push only** for a site-less account |
| status | `synced` / `syncing` / `error syncing` / `no site`, the same `sync_status` the API reports |
| posts, chunks | The size of that customer's index, across every connection they own |
| created | When you provisioned them |
**Search** filters on uid, label and site domain with one query, and composes with pagination. Your input is matched literally, so a `%` finds nothing rather than everything.
Creating, re-syncing and deleting stay API-only, on purpose: provisioning is driven by your signup flow, not by hand.
## Fleet query log: `/white_label/responses`
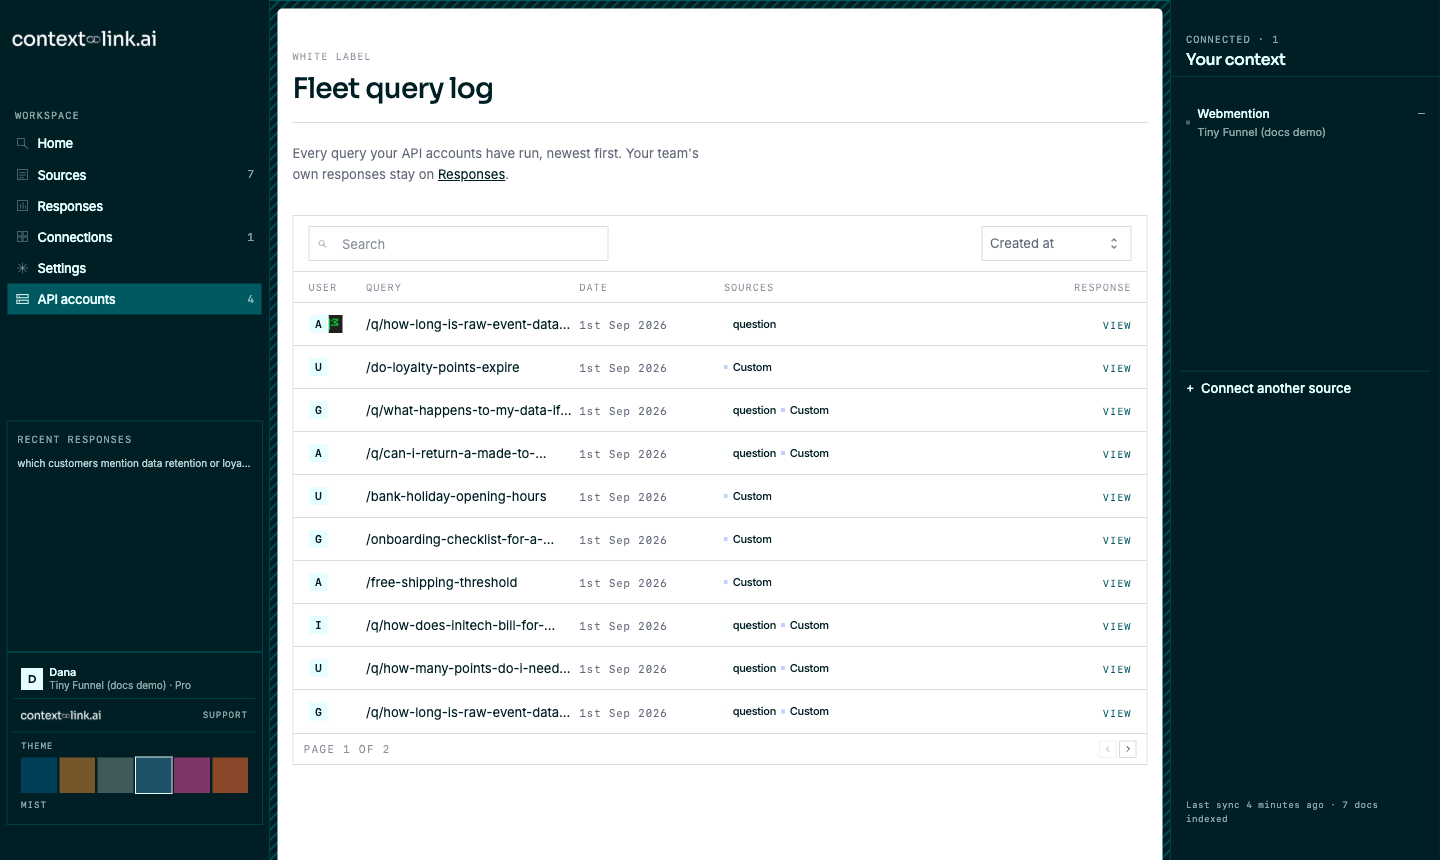
Every `/context` and `/question` call your API accounts have made, newest first, 10 per page, searchable. Clicking a row opens the response drawer: the answer that was returned, its citations, the score, and which of that customer's sources were used: the audit trail for "what did our product actually tell this customer?".
Two boundaries worth knowing:
- **Your team's own queries are not here, and fleet queries are not on `/responses`.** The split is total and applies in both directions.
- **Citations in the fleet drawer render as text, not links.** The cited source belongs to a customer's index, so the drawer names it without opening a read path into tenant content.
Org-wide queries made with the **provisioning token** are your organisation's own traffic, so they appear on `/responses`, not in the fleet log.
## Every screen at a glance
| Path | What it is |
|---|---|
| `/white_label/api_accounts` | Fleet: usage strip, searchable table, pagination |
| `/white_label/responses` | Fleet query log: every customer query, searchable, with the response drawer |
| `/white_label/connection_activations` | Which source types your customers may connect, and your own OAuth keys for them |
| `/user/settings#provisioning-token` | Provisioning token, default webhook URL, webhook signing secret |
| `/responses` | Your own team's queries, never fleet traffic |